4. Survey Application
version 18.0
TABLE OF CONTENTS
1. Introduction
1.1. Survey Application
The Survey application is an Odoo module that allows businesses to create and manage online surveys. The module supports various question types, branch logic design, feedback collection, and visual result statistics.

1.2. Purpose of Use
- Collect opinions from customers, employees, or partners.
- Evaluate satisfaction levels, training effectiveness, and candidate capacity.
- Support processes such as recruitment, internal operations, and market research.
1.3. Definitions
- Survey (Survey): A questionnaire designed to collect information.
- Page (Page): A collection of questions displayed on the same screen.
- Question (Question): The content that the surveyor needs to answer.
- Question Type: Multiple choice, free text, matrix, scoring...
- Live Session (Live Session): A direct survey session, often used for training or exams.
1.4. Scope of Application
- Internal: HR surveys, performance evaluations, knowledge tests.
- Customers: Satisfaction surveys, post-sales feedback.
- Recruitment: Candidate assessment via tests.
- Training: Post-course testing.
2. Implementation Steps
2.1. Managing Surveys from Dashboard
2.1.1. Accessing Dashboard
- From the main menu, select Surveys to open the application's Dashboard interface.
- The default interface is the Kanban view, displaying surveys as cards (Figure 1).
 Figure 1
Only users granted Survey rights can access the Survey application.
2.1.2. Information Displayed on Each Survey
- ➀ Survey name and a half-trophy icon if it is a Certification. Person in charge, creation month.
- ➁ Number of questions in the survey.
- ➂ Average time to complete the survey.
- ➃ Number of registered participants.
- ➄ Number of completed surveys.
- ➅ Passed and Certified ratio (if the survey has scoring configured or is a certification).
- ➆ Number of related courses (if linked).
2.1.3. Actions in the Dashboard
| Button | Application |
| Share | Open the survey sharing window via link or email. Can add recipients, edit email templates, attach files, and set response deadlines. |
| Test | Open the survey in test mode before publishing. |
| See Results | Open feedback statistics report: charts, ratios, time... |
| Start Live Session | Start a live survey (for training, seminars). |
| Close Live Session | End a live survey session (if started). |
| 3 dots (⋮) | More options: Edit, Share, Delete, choose color. |
| Activities (🕘) | Schedule and manage survey-related activities. |
 Figure 2
2.1.4. Switching Dashboard Views
- List view (≣): switch to table format to view multiple surveys quickly.
- Activities view (🕘): displays related activities, helping to track schedules and tasks.
- Custom columns can be added in List View using the ⚙ (Slider) icon.
2.2. Create New Survey
- Go to the Surveys menu and click New (Figure 3).
Creating a new survey is only done in Kanban view / List view
 Figure 3
Select survey type (Figure 4):
- Survey: Used to collect opinions, feedback, or mass opinion surveys.
- Live Session: Used for workshops, training, classrooms – the survey takes place simultaneously and is controlled by the facilitator.
- Assessment: Knowledge testing, capacity assessment.
- Custom: Allows users to self-select and configure all options.
- Recruitment: Used to evaluate candidates during the recruitment process.
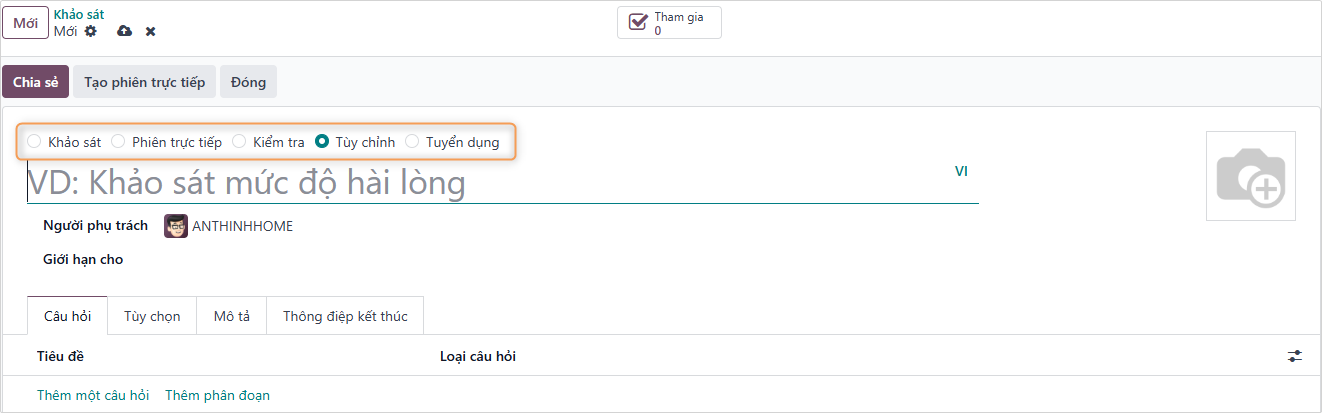 Figure 4
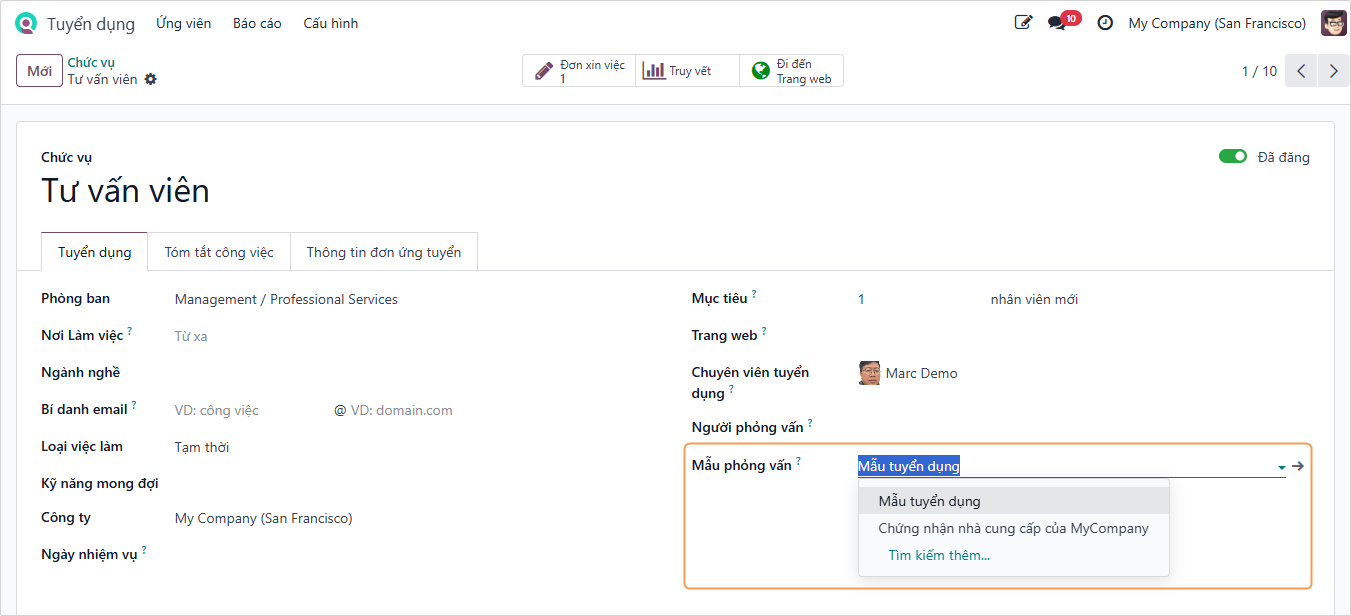
When selecting the survey type as Recruitment, in the Recruitment module, you need to configure the selection of Interview Form
Refer to the application Recruitment
- Enter Survey Title and select Responsible for this survey.
- Add a survey background image using the camera icon 📷.
2.2.1. Designing the Questionnaire and Sections
- Click Add a Question to see the list of question types (Figure 5).
- Each question type will have different answers and options.
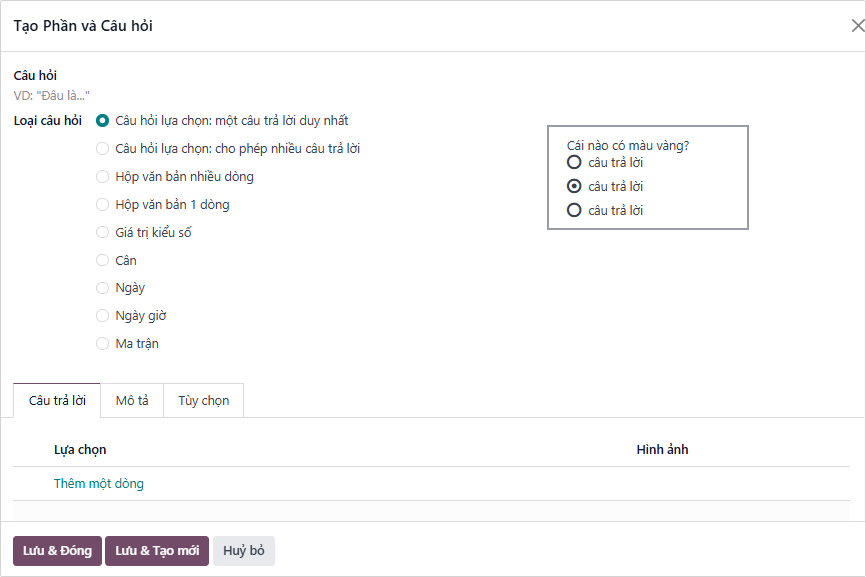 Figure 5
Questions and sections can be dragged and dropped to arrange them logically.
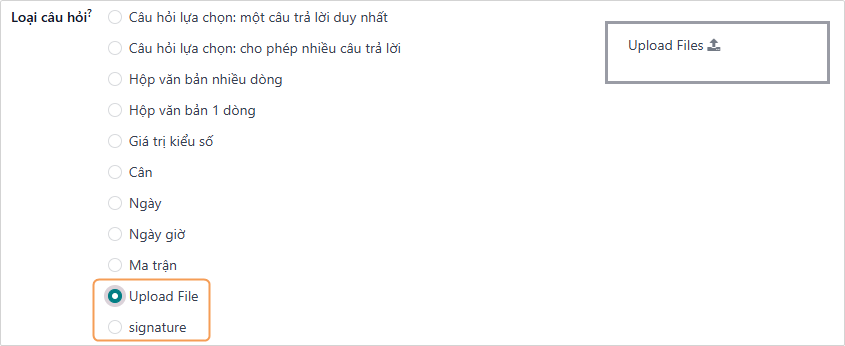
- For Surveys requiring additional file attachments or a confirmation signature from the surveyor, select the Upload File or Signature question type.
- Upload File: Send attached files when surveying, can select to send multiple files.
- Signature: This question is often used to end the survey (with mandatory option).
2.2.2. Display Options and Survey Configuration
 Figure 6
- Questions.
- Pagination: Set the display of the survey.
- One page per question: Each question will correspond to 1 page.
- One page per section: Questions belonging to the same area will be presented on 1 page.
- One page with all the questions: All questions will be presented on 1 page.
- Display progress as:
- Percentage left: Display % of survey completion progress (Example: Completed question 1/10, progress will be 10%).
- Number: Display progress by quantity (Example: Completed question 1/10, progress will be 1/10).
- Question Selection: Display all questions or randomize per session.
- Allow Roaming: Allow going back to the previous page.
- Pagination: Set the display of the survey.
- Participants.
- Access Mode: Allow surveying anyone with the link or only invited people.
- Require Login: Survey participants are required to log in to the system.
- Limit Attempts: If selecting that participants need to log in to take the survey, you can set a limit on the number of survey attempts by the participant here.
- Time & Scoring.
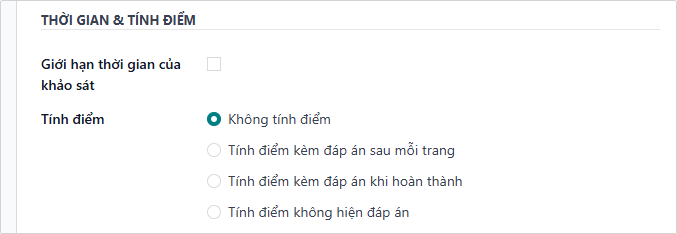
- Survey Time Limit: Set a time limit.
- Scoring: Set the scoring method for the survey. If scoring is selected, the information below needs to be set.
- Scoring with answers at the end of each page: If this survey is used for certification, you need to set the score condition that participants need to achieve to receive the certificate here. The score condition is expressed as the percentage of correct answers in the survey.
- Scoring with answers at the end: Check this box if you want to set up a certification exam, then you can select a certificate template, preview the certificate template by clicking Preview.
- Is a Certification: Select a certification email template. This email will be automatically sent to participants who achieve the certification.
- Live Session: Create an online survey session.
2.2.3. Description Tab and End Message
- Description: Detailed description of the survey.
- End Message: Thank you content after completing the survey, can insert images.
2.2.4. Action Buttons on Survey Form
 Figure 7
- Share: Share via email or public link (depending on options in the Participants section).
- See Results: View completed survey results.
- Test: Test the survey.
- Close / Reopen: Proceed to Close (Archive) or Reopen the survey.
2.3. Analyzing Survey Results
On the Survey dashboard, to the right of each survey line displayed in the default list view, there is a See Results button (Figure 8).
 Figure 8
When clicking the See Results button, a new browser tab will open, displaying a separate page containing all results and responses of that survey, along with a Results Overview providing information and some dropdown filter menus at the top (Figure 9).
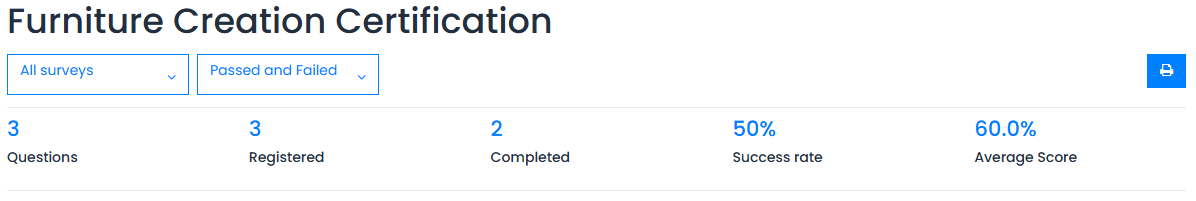 Figure 9
The dropdown menu with various filter options can be used to personalize and segment survey results in different ways.
The leftmost dropdown menu is All surveys, meaning the results below display results and responses from all submitted surveys, regardless of whether they have been fully completed or not.
When clicking that dropdown menu to open, another option Completed surveys will appear (Figure 10).
 Figure 10
When opening the dropdown menu, the number corresponding to each filter option will appear to the right of each option.
To the right of the dropdown menu is the Passed and Failed option menu by default. This option displays results and responses from all participants who passed or failed this specific survey.
Note: The second dropdown menu of these filter options only appears if the survey being analyzed has the Scoring option configured or if the Is a Certification feature has been enabled.
When clicking the second dropdown menu of filter options, two additional options will appear: Passed only and Failed only (Figure 11).
 Figure 11
Each option will filter the results below to show only responses from participants who passed the survey or failed the survey.
Right below the survey title, there is a Print button. When clicked, the entire results page can be printed.
2.4. Question Analysis
Right below the Results Overview section is where the survey results and responses are displayed.
Different sections of the survey, if any, will also appear at the top of the corresponding questions on the results page for easier organization.
Each question in the survey is displayed with in-depth analysis and illustrations of how participants answered below the Results Overview section.
Below the question are indicators to see how many participants answered and how many skipped the question (Figure 12).
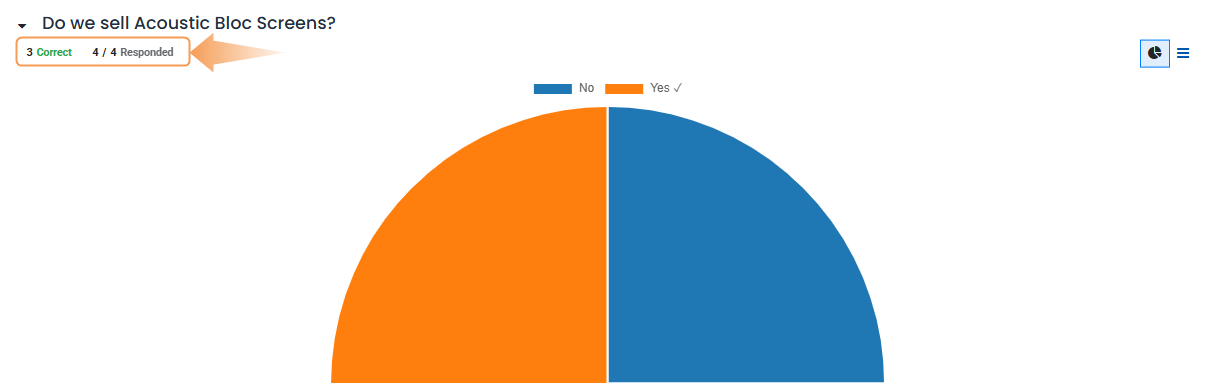 Figure 12
If the question requires participants to enter their own answer without any options to choose from, such as entering a specific number or date, there is also an indicator to display the number of users answering the question Correct (Figure 13).
 Figure 13
Even if no correct answer is configured for a question of this nature, the Correct indicator still appears, although it shows a 0 mark.
If there is only one correct answer for a multiple-choice question, those results and answers are represented by a Pie Chart. The correct answer is indicated by a ✔️ (Checkmark) icon next to the correct answer option, in the legend above the chart.
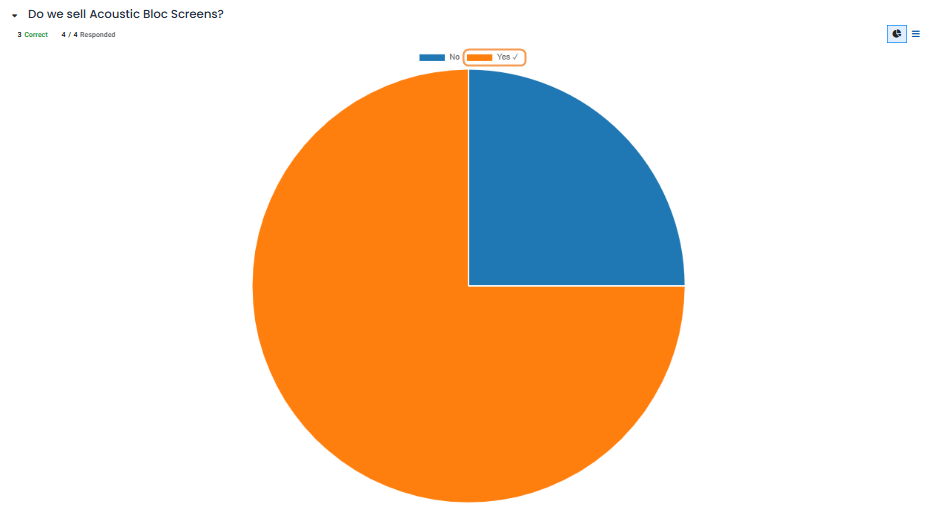 Figure 14
If there are multiple correct answer choices (or no correct answer at all) for a multiple-choice question, those results and responses will be represented by a Bar Chart (Figure 15).
 Figure 15
Each multiple-choice question has a Graph tab and a Data tab. The graph-related tab is displayed by default.
The Data tab displays all Answer options provided for the question. User Choice (with percentage and votes) along with the Score of each option (Figure 16).
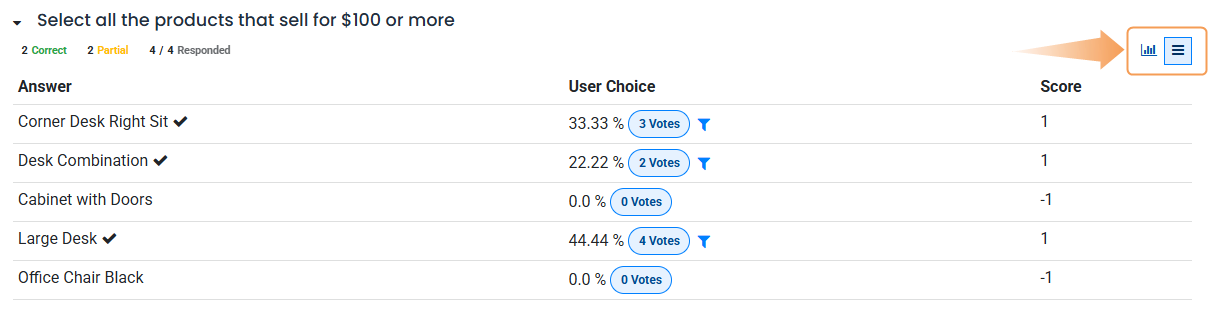 Figure 16
If a question requires participants to enter a numerical value as an answer, the Maximum, Minimum, and Average indicators will appear to the right of the results tab (Figure 17).
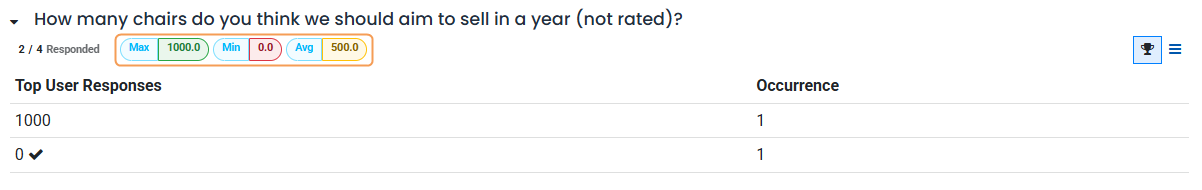 Figure 17
2.5. Participations
To view a consolidated list of participation results for a specific survey, navigate to the Survey app, select the desired survey from the list, and click the Participations button at the top of the survey form.

When performing this action, a separate Participations page will display the participants of that specific survey along with information relevant to each person (Figure 18).
 Figure 18
Here, users can view information related to each participant who has taken that specific survey. If they want to see a more detailed analysis of their various answers and responses, they can click on any participant and Odoo will display a separate page showing detailed survey information for that participant along with their submitted answers (Figure 19).
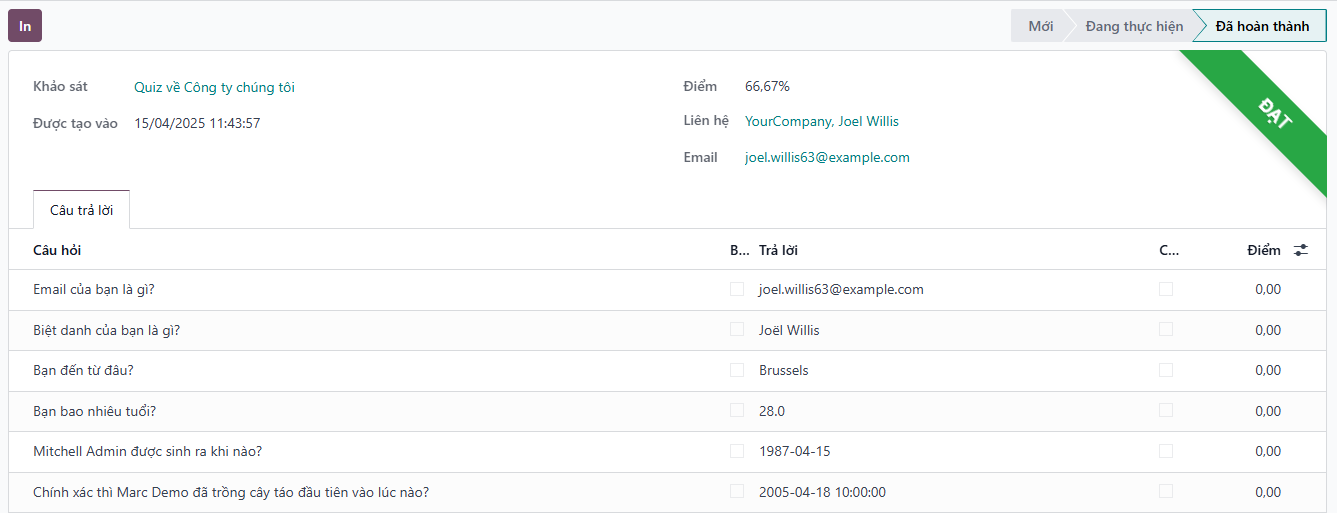 Figure 19
To view a consolidated list of all participants in all surveys in the database, navigate to Apps > Surveys > Participations. Here, every survey in the database is displayed in a default nested list. Next to each survey title is the number of participants in parentheses (Figure 20).
 Figure 20
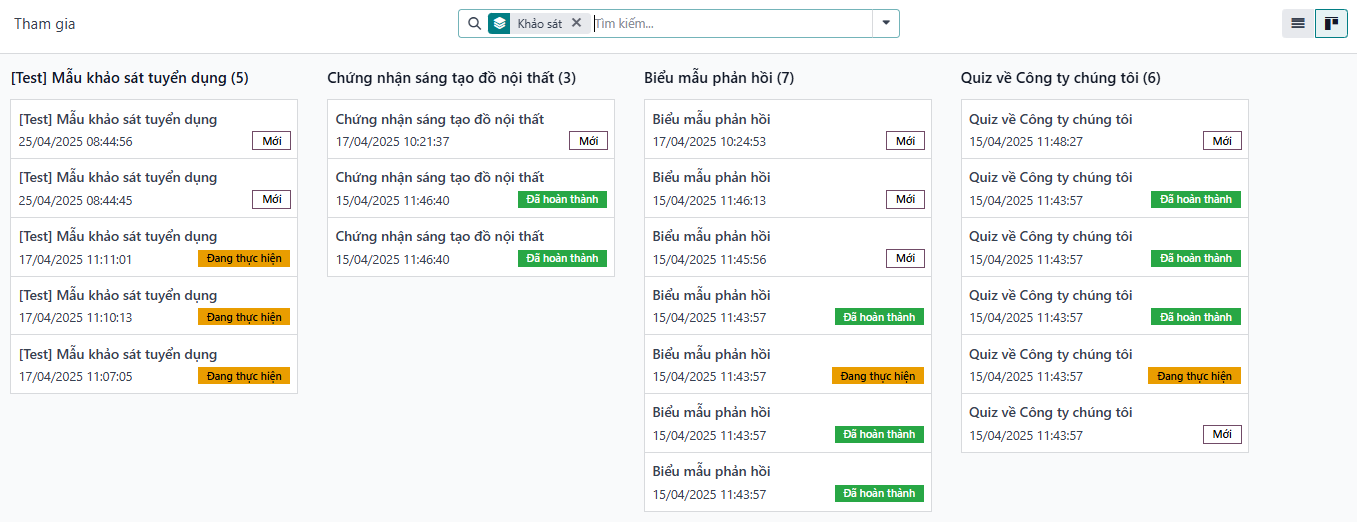 Figure 21 - View participants in Kanban mode